Universal Content Puller Charts

If you can pull data to a table, you can show it in a chart!
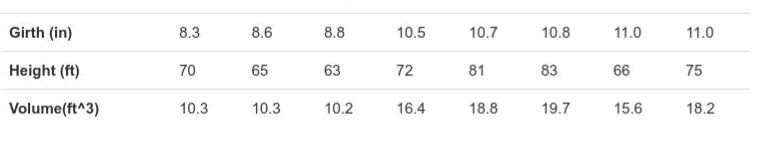
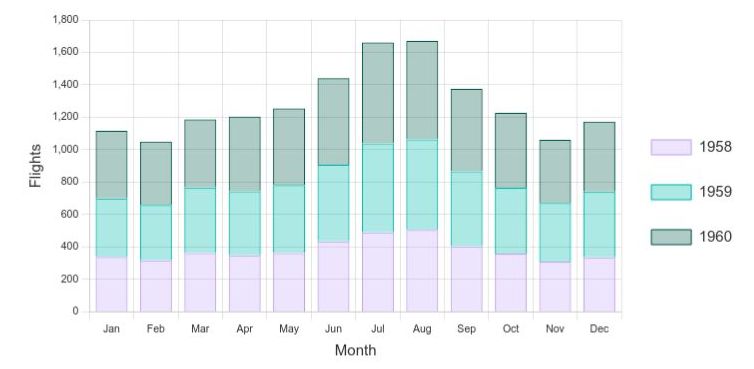
Brighten up your data display with beautiful charts. Universal Content Puller Charts displays bar charts, line charts, pie charts and more from tabular data pulled through Universal Content Puller.
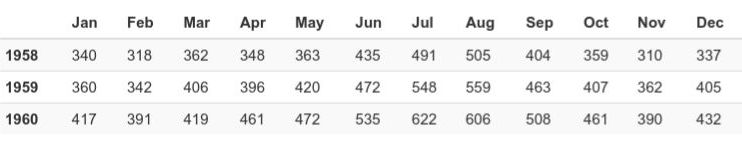
Create charts from CSV, JSON, XML, Database Queries, Express Entities, User Lists, Page Lists, Google Sheets and more. Create charts from any tabular data you can pull or extract with Universal Content Puller.
Chart types supported include:
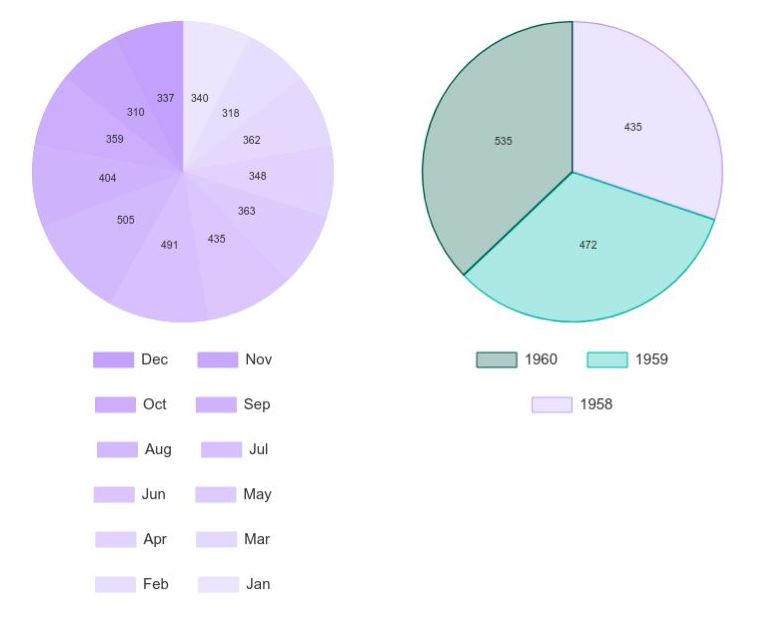
- Pie
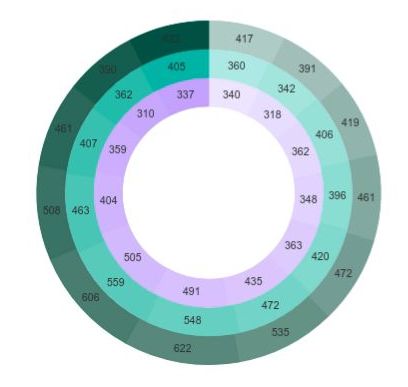
- Doughnut
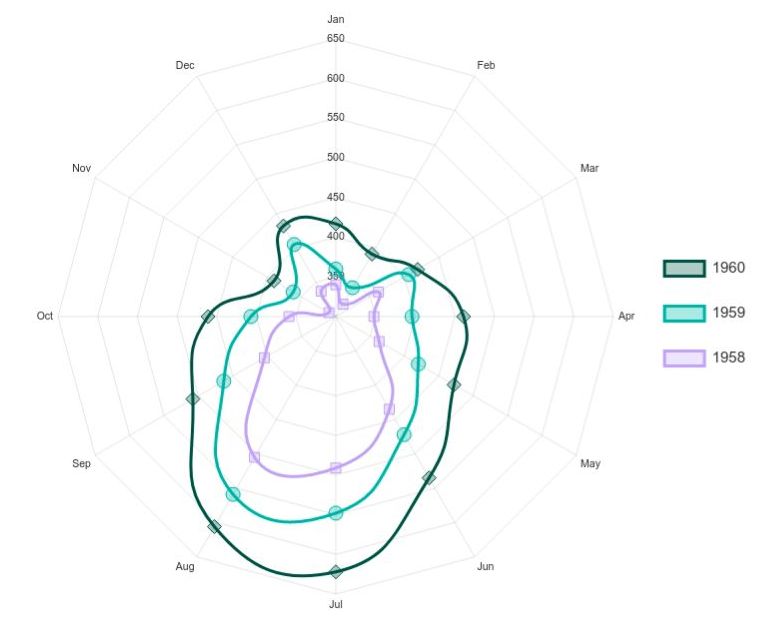
- Radar
- Polar area
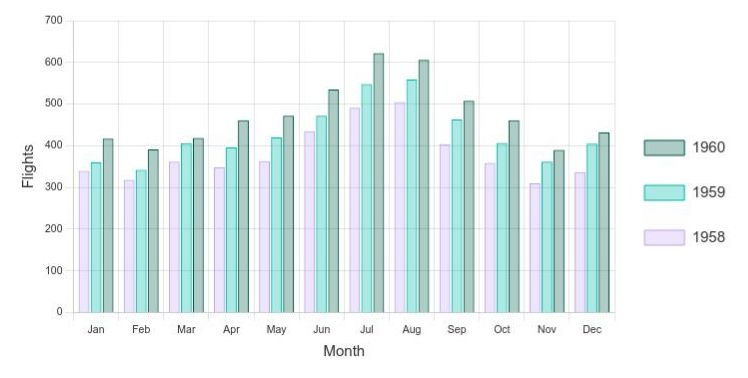
- Bar
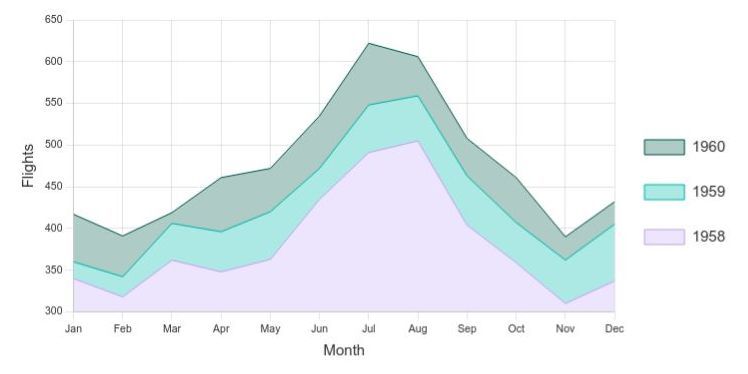
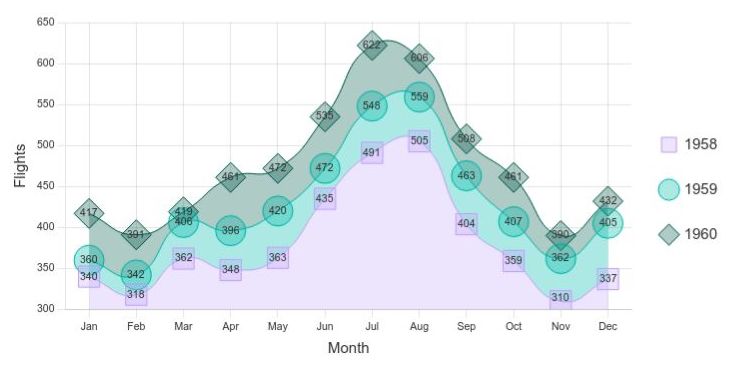
- Line
- Scatter
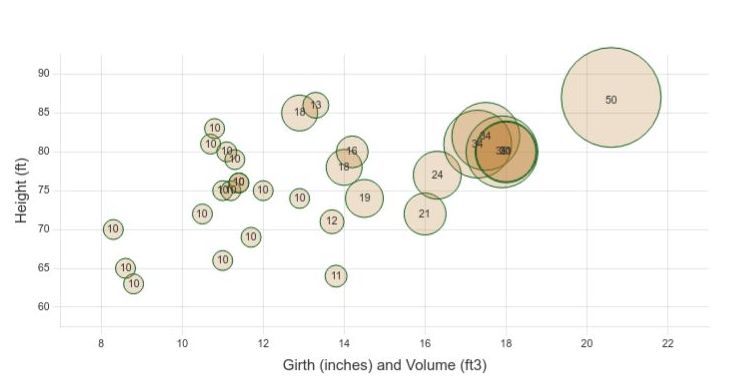
- Bubble
- Key - a key for any of the above
Within these general types, charts can be filled, stacked, coloured and redesigned in many ways to look great on your web pages.
Also Check Out
Universal Content Puller XX Sources
MySQL and SQLite database extension for Universal Content Puller
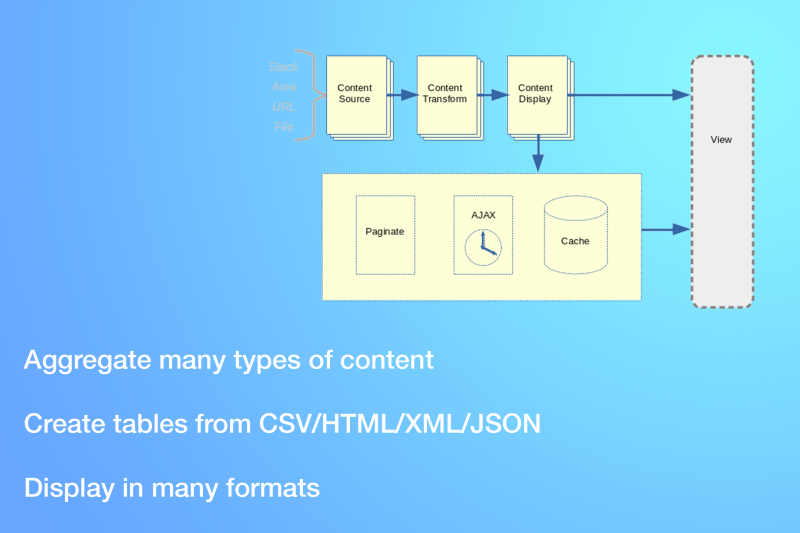
Universal Content Puller
Pull content from many places. Extract and transform it between many representations. Display it in many ways.
Author

Also Check Out
Universal Content Puller XX Sources
MySQL and SQLite database extension for Universal Content Puller
Universal Content Puller
Pull content from many places. Extract and transform it between many representations. Display it in many ways.